WALHT: Find and continue a pattern recording results as a table.
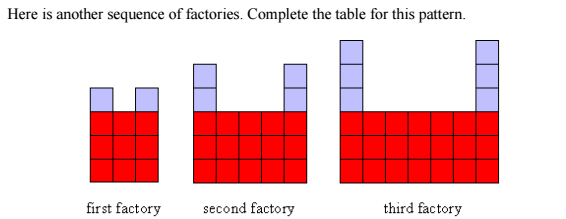
Using the information in the model above, I analysed the pattern and put that information into the table below.
Factory Number
|
1
|
2
|
3
|
4
|
5
|
Number of grey squares
|
2
|
4
|
6
|
8
|
10
|
Number of red squares
|
9
|
15
|
21
|
27
|
33
|
Number of all squares
|
11
|
19
|
27
|
35
|
43
|
Rule for grey squares: Add 2.
Rule for red squares: Add 6.
Rule for all squares: Add 8.
Using the information from the table, I was able to respond to the questions below.
- How many grey squares do we need for the eighth factory?
16.
- How many grey squares will we need for the hundredth factory?
200.
- What is the number pattern for the grey squares?
Add 2 or multiply 2.
- How many red squares do we need for the ninth factory?
57.
- If there are 14 grey squares how many red squares are there?
45.
- What is the number pattern for the red squares?
Add 6.
- How do we get the number of red squares for one factory from the number of red squares in the factory before that?
3 red squares.
- If we have to use exactly 36 red squares in making a factory, how many grey squares would we need?
11 grey squares.
- How many squares do we need altogether for the seventh factory?
69 squares.
- What is the number pattern that we are getting for the total number of squares?
Add 8.
- If we had 35 tiles, which numbered factory could we make?
4 factories.
- Which of these numbers are not a number of squares for one of these factories: 20, 21,22, 23?
All of them.
Pattern for horizontal axis
|
2
|
4
|
6
|
8
|
10
|
Pattern for vertical axis
|
4
|
8
|
12
|
16
|
20
|
Finally, I entered and then selected the data from the spreadsheet below to create the graph.
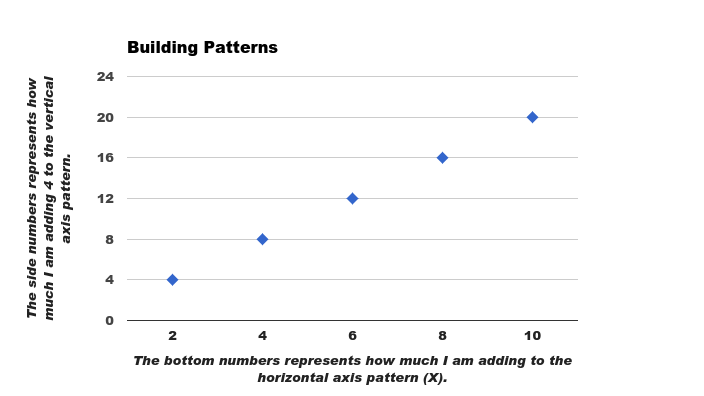
This graph shows the number pattern I am adding to the vertical axis and how many numbers I am adding in a pattern for the horizontal axis.
No comments:
Post a Comment